Take a CloudWatch Logs bill of $786.60.
The first remediation ticket says: “Set every log group to 30-day retention.” It is a safe ticket. It is easy to review. It also attacks $18.60 of the bill.
The other $768 is fresh log ingestion. Retention won't touch it.
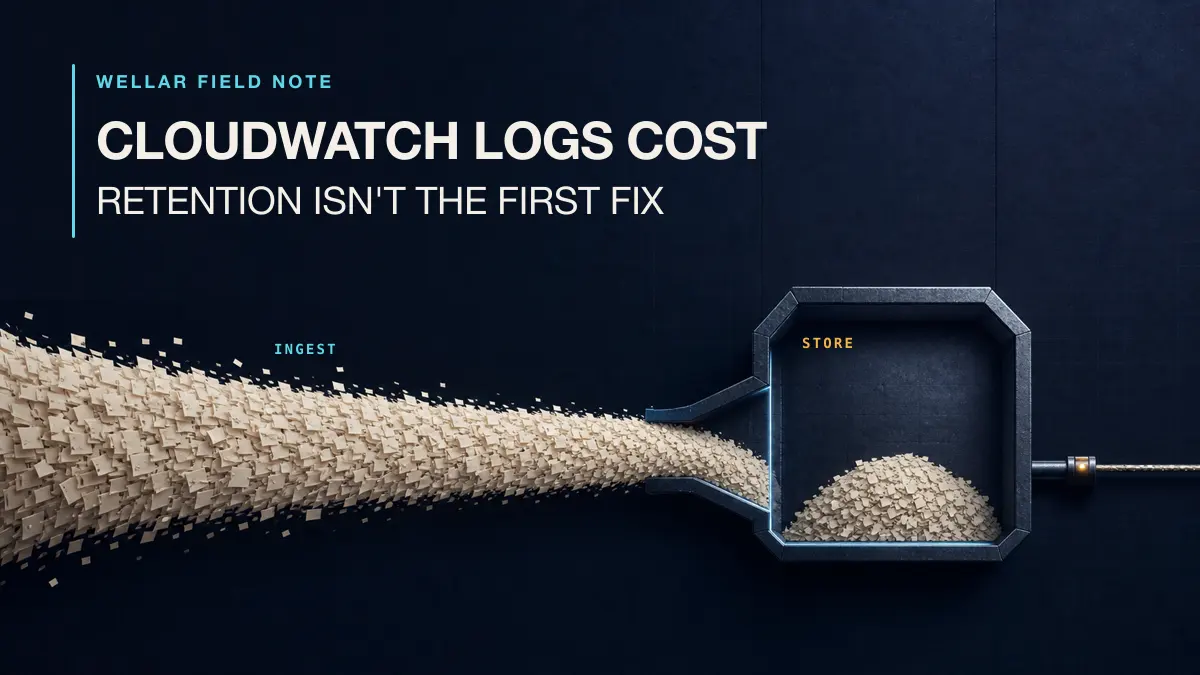
That gap is the reason a lot of CloudWatch Logs cost optimization work feels productive and produces a disappointing invoice. The team shortens retention, watches StoredBytes fall, and leaves the application writing the same debug payload 40 times a second. The reservoir gets smaller. The pipe stays open.
My rule is simple: split the bill into collect, store, and analyze before changing anything. If collection is the large number, fix the producer. If storage is the large number, fix retention. If queries are the large number, fix how people search.
Retention still matters. It just isn't the first question.
CloudWatch is not one line item. Metrics, alarms, logs, dashboards, Container Insights, Application Signals, and API calls all arrive under the same service name. Even CloudWatch Logs breaks into separate usage types.
Start in Cost Explorer:
- Open Billing and Cost Management in the AWS Console.
- In the left navigation, choose Cost Explorer.
- Choose New cost and usage report.
- Set the date range to the last full month. Leave granularity at Monthly.
- Under Filters, choose Service, select CloudWatch, and apply the filter.
- Set Group by to Usage type.
- Switch the chart to a table or scroll to the table below it.
- Sort by Unblended cost from highest to lowest.
AWS prefixes usage types with a Region code, so DataProcessing-Bytes might appear as USE1-DataProcessing-Bytes. The suffix is the useful part:
| Usage-type suffix | What you paid for |
|---|---|
DataProcessing-Bytes | Custom-log ingestion into Standard log groups |
DataProcessingIA-Bytes | Custom-log ingestion into Infrequent Access log groups |
TimedStorage-ByteHrs | Archived log storage |
DataScanned-Bytes | Data scanned by Logs Insights queries |
Logs-LiveTail | Live Tail session usage |
VendedLog-Bytes | AWS-service logs delivered to Standard log groups |
VendedLogIA-Bytes | AWS-service logs delivered to Infrequent Access log groups |
DataProtection-Bytes | Data scanned for sensitive-data detection and masking |
Those names come from AWS’s own CloudWatch billing guide, and they are much more useful than the service total. A $900 CloudWatch line can be a logging problem, a high-cardinality custom-metric problem, or a dashboard making expensive API calls. Treating all three as “log retention” is how you spend a day fixing the wrong service.
If you need the exact log group rather than the operation, change Group by to Resource. AWS documents one catch: Cost Explorer exposes CloudWatch resource-level usage for only the previous 14 days. For a full-month resource ledger, use a Cost and Usage Report with resource IDs enabled.
Don't move on until you can finish this sentence: “Most of this bill is collection, storage, or analysis.”
Here is the model behind the opening number. It is not a customer bill. It uses the US East (N. Virginia) rates on the CloudWatch pricing page and assumes the account has already used the 5 GB free tier.
The application sends 1,536 GB of uncompressed logs into Standard-class log groups during the month. At the first ingestion tier:
1,536 GB × $0.50/GB = $768.00 ingestionThe account also holds 620 GB of compressed archived logs:
620 GB × $0.03/GB-month = $18.60 storageTotal:
$768.00 + $18.60 = $786.60/monthNow assume 40% of the incoming bytes are DEBUG events, successful health checks, and repeated request bodies that nobody uses:
1,536 GB × 40% = 614.4 GB avoidable ingestion
614.4 GB × $0.50/GB = $307.20/month
Deleting every stored byte would save at most $18.60 in this model. Removing the avoidable source volume saves $307.20 on ingestion, then reduces future storage as a side effect.
That is a 16.5× difference between the two tickets.
The example is intentionally below the first 10 TB ingestion tier. Above that, CloudWatch applies volume pricing and the marginal rate changes. Prices also vary by Region. Re-run the arithmetic with the rate on your own bill; don't paste $0.50 into a finance forecast and call it universal.
There is an important exception. A low-volume audit log group that has accumulated seven years of data can be storage-heavy. Retention may be the right first move there, assuming the legal owner agrees. The argument is not “retention never saves money.” The argument is “look at the operation before guessing.”
StoredBytes answers “what is sitting here now?” It doesn't answer “what is making this month expensive?” For the second question, use IncomingBytes.
CloudWatch Logs publishes IncomingBytes in the AWS/Logs namespace for each LogGroupName. AWS defines it as the uncompressed volume uploaded to a log group. Better still, AWS publishes the exact Metrics Insights query needed to rank the noisy groups.
In the Console:
- Open CloudWatch.
- In the left navigation, choose Metrics → All metrics.
- Choose Multi source query, then switch from Builder to Editor.
- Paste the query below.
- Set the time range to 2 weeks — the longest range Metrics Insights supports.
- Choose Run.
- Open Graphed metrics and use a one-day period if the chart is too dense.
SELECT SUM(IncomingBytes)
FROM SCHEMA("AWS/Logs", LogGroupName)
GROUP BY LogGroupName
ORDER BY SUM() DESC
LIMIT 10
This is one of the official Metrics Insights sample queries. The query editor itself is free to use. It returns the ten log groups receiving the most bytes in the selected Region; repeat it in each Region that has material CloudWatch spend.
The first result is usually enough to change the conversation. /aws/lambda/orders-api-prod points at application logging. /aws/containerinsights/prod/application points at container collection. A VPC Flow Logs group points at vended logs and a destination choice. The bill tells you the operation. IncomingBytes tells you where to look.
For storage, use a different inventory:
aws logs describe-log-groups \
  --region us-east-1 \
  --query 'reverse(sort_by(logGroups,&storedBytes))[:20].{Group:logGroupName,Class:logGroupClass,Retention:retentionInDays,StoredBytes:storedBytes}' \
  --output table
An empty Retention cell doesn't mean zero days. It means the events never expire.
Keep the two lists separate. The group with the most stored bytes may be quiet today. The loudest group today may have seven-day retention and almost no archive. Combining them into one “largest log group” list hides the decision you are trying to make.
Once you have the top group, inspect the producer before touching CloudWatch settings.
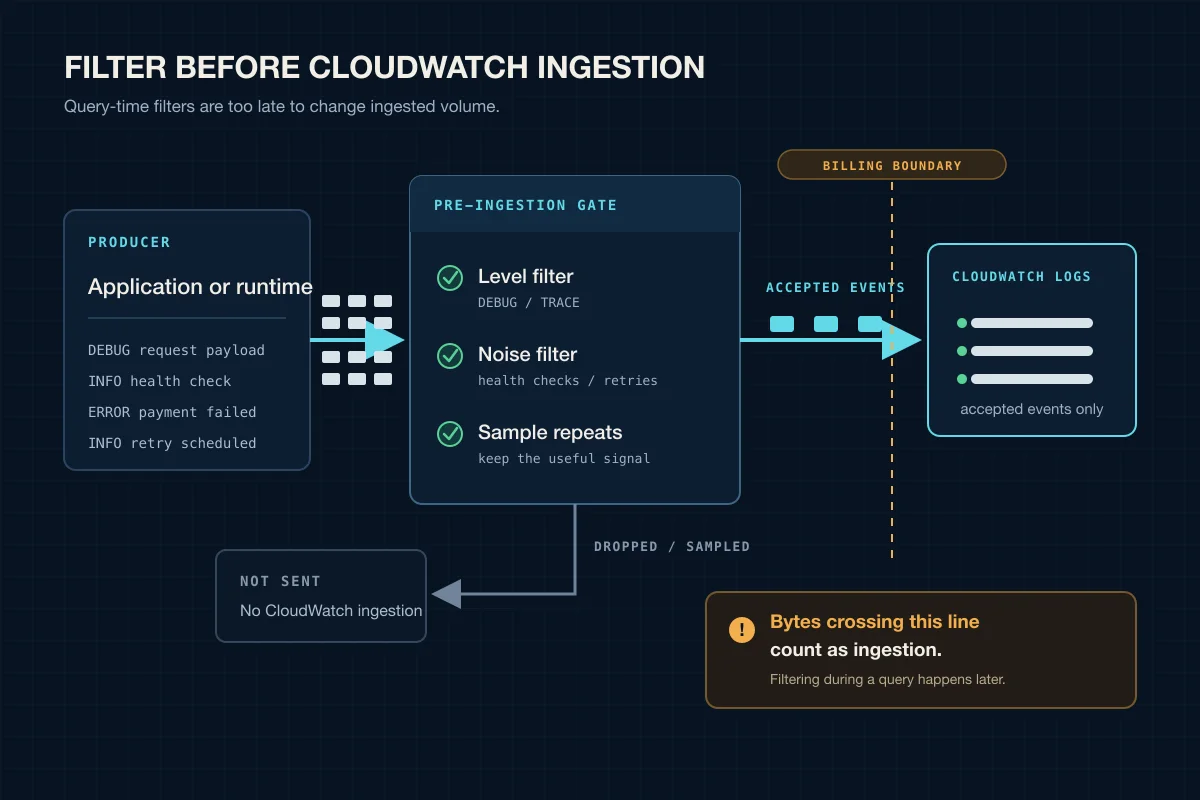
The cost boundary is the ingestion API: filter or sample before events cross it.
That boundary is the important part. Filtering in Logs Insights changes what a query returns; it does not reduce bytes already ingested. Put the gate in the application logger, the Lambda logging configuration, or the collector or router before its CloudWatch output.
For Lambda, the cheapest log event is the one Lambda never sends. Supported runtimes can use advanced logging controls to filter application and system logs before delivery. The function must use JSON log format for application log-level filtering.
Console path: Lambda → Functions → your function → Configuration → Monitoring and operations tools → Logging configuration → Edit.
- Set Log format to JSON.
- Set Application log level to INFO if production is still sending
DEBUGorTRACE. - Leave System log level at INFO unless you have confirmed that you do not rely on successful
STARTandREPORTevents. - Save the configuration.
- Invoke the function through one normal and one error path, then confirm the expected events in CloudWatch Logs.
The equivalent CLI command is:
aws lambda update-function-configuration \
  --function-name orders-api-prod \
  --logging-config LogFormat=JSON,ApplicationLogLevel=INFO,SystemLogLevel=INFO
AWS notes a sharp edge in its Lambda log-level documentation: a log level set inside the function code can take precedence over the service configuration. Don't assume the change worked because the API returned 200. Watch IncomingBytes after the deployment.
For ECS or EKS, check both the application and the collector. A chatty health endpoint logged once by the app, once by the sidecar, and once by an ingress controller becomes three paid events. CloudWatch’s pricing page also says Container Insights adds 700 bytes of metadata per collected container log line. That metadata is useful for filtering. It is expensive when attached to millions of low-value lines.
I would remove, sample, or aggregate these first:
- successful health and readiness checks;
- request and response bodies on successful calls;
- per-item progress inside batch loops;
- duplicate stack traces written by two layers;
DEBUGlogging left on after an incident;- full configuration objects repeated on every invocation.
Don't cut errors, authorization failures, deployment markers, or the fields your incident queries actually use. Logging less is not the same as logging blindly. The goal is to preserve evidence and remove repetition.
Vended logs need a different decision. If VPC Flow Logs exist for audit and occasional forensics, S3 may be the better destination. If you need metric filters, subscription filters, or near-real-time alarms, CloudWatch Logs earns its price. AWS gives the same split in its billing guidance: CloudWatch for active monitoring features; S3 for audit-oriented VPC Flow Logs.
“Log everything forever” is not observability. It is the absence of a logging design.
CloudWatch Logs has Standard and Infrequent Access classes. The name makes Infrequent Access sound like a storage tier. It is not. AWS charges the same archive-storage and Logs Insights rates for both classes; the price difference is ingestion.
In US East (N. Virginia), the pricing examples are $0.50/GB for Standard ingestion and $0.25/GB for Infrequent Access ingestion at the first tier. Infrequent Access can be a clean 50% ingestion cut for logs that are queried after the fact.
The trade is features:
| Choose | When it fits | What to check first |
|---|---|---|
| Standard | On-call troubleshooting, metric filters, subscription filters, Live Tail, anomaly detection, embedded metrics | Which real-time features are attached to the group? |
| Infrequent Access | Audit trails, batch-job history, and forensic logs queried occasionally with Logs Insights | Can the team live without metric filters, subscriptions, Live Tail, and GetLogEvents? |
Infrequent Access is more capable than it was at launch. In March 2026, AWS added data protection plus OpenSearch PPL and SQL support. It still isn't a drop-in Standard replacement. The current log-class feature table is the checklist to read before choosing it.
There is a worse catch: the class can't be changed after the log group is created.
For a new forensic group:
aws logs create-log-group \
  --region us-east-1 \
  --log-group-name /archive/batch-import \
  --log-group-class INFREQUENT_ACCESS
For an existing Standard group, create a new Infrequent Access group and repoint the producer. Don't discover after the cutover that a subscription filter was feeding your SIEM. Inventory every filter, alarm, export, and responder workflow first.
CloudWatch Logs keeps data indefinitely by default. That default is convenient during setup and indefensible once the workload has an owner.
Find the groups with no retention policy:
aws logs describe-log-groups \
  --region us-east-1 \
  --query 'logGroups[?retentionInDays==null].{Group:logGroupName,StoredBytes:storedBytes,Class:logGroupClass}' \
  --output table
Then set one deliberately:
aws logs put-retention-policy \
  --region us-east-1 \
  --log-group-name /aws/lambda/orders-api-prod \
  --retention-in-days 30
AWS says expired events can take up to 72 hours to be deleted. Once they are marked for deletion, they stop adding to archive-storage charges and disappear from the storedBytes value even if physical deletion is still pending.
Thirty days is not a magic number. A dev function may need seven days. A production API may need 30 or 90. An audit trail may need a year or a separate archive because of a written policy. The correct value comes from incident-response and compliance requirements, not from whichever Terraform example the team copied.
Every Never expire group should have a named owner who can explain why it is permanent. Without that owner, “forever” is not a retention policy. It is a missing decision.
If you have ten minutes, do only this:
- Open Cost Explorer, filter to CloudWatch, and group by usage type.
- Decide whether the large number is ingestion, storage, or analysis.
- If it is ingestion, run the
IncomingBytesMetrics Insights query and copy the top log-group name. - Open that producer and find one removable event class:
DEBUG, health checks, duplicate payloads, or per-item loop logs. - Put the arithmetic in the ticket.
Use this shape:
14-day IncomingBytes: 716.8 GB
projected month: 716.8 ÷ 14 × 30 = 1,536 GB
current Standard ingestion: 1,536 × $0.50 = $768/month
avoidable share measured from a sample: 40%
expected reduction: 1,536 × 40% × $0.50 = $307.20/month
Then set retention. It is good housekeeping, it caps future storage, and it forces the team to decide how long its evidence matters.
Just don't confuse housekeeping with closing the valve. A 30-day retention policy on a firehose is still a firehose.
- Amazon CloudWatch pricing
- Analyzing, optimizing, and reducing CloudWatch costs
- CloudWatch Logs metrics and dimensions
- CloudWatch Metrics Insights sample queries
- CloudWatch Logs log classes
- Working with log groups and retention
- Lambda log-level filtering
- March 2026 CloudWatch Logs Infrequent Access update