A founder messages you on a Sunday at 22:14. One screenshot. AWS bill went from $14,200 last month to $19,840 this month. Nothing shipped. He needs a number by 9 AM Monday.
You could open Cost Optimization Hub. You could open Trusted Advisor. You could pull thirty items from a "how to lower your AWS bill" listicle and tell him to do all of them. None of that is what a senior engineer actually does.
What a senior engineer does is ask eight questions in a specific order, and the order matters more than the list.
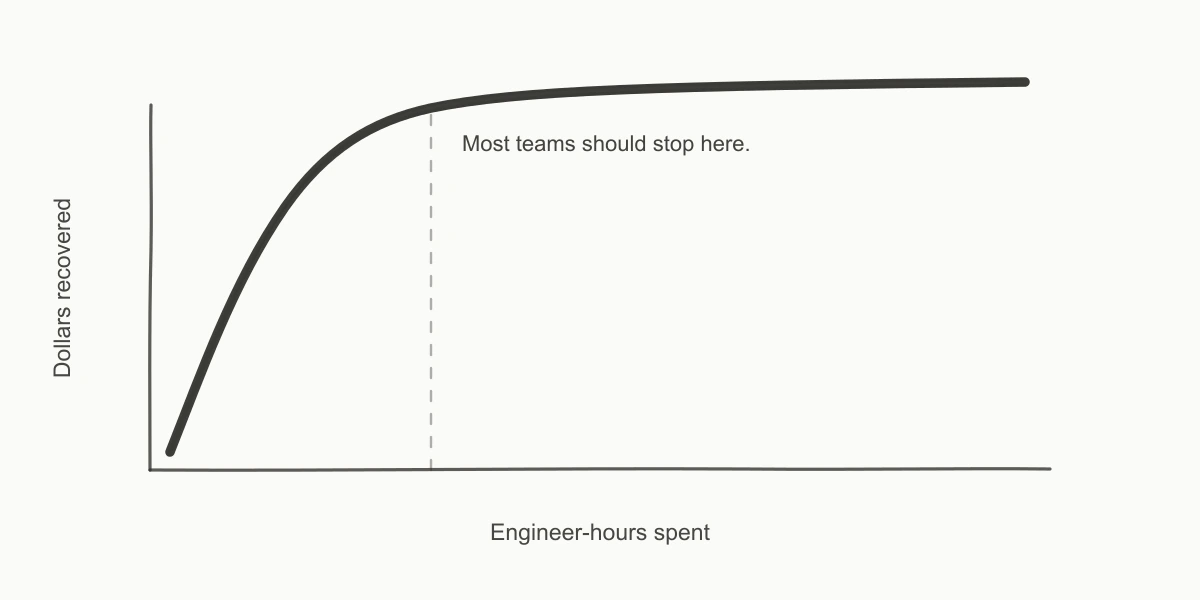
Question 1 takes about ten minutes and usually finds 15–30% of the surprise. Question 8 takes a day and might find another 5%. The whole point of writing this down is that you are supposed to stop when the savings stop being worth the time. I have changed my mind on this in the last three years — I used to run the full checklist every time, and most of those afternoons were wasted.
This is the triage sheet I actually use. Console paths included. Skip the ones that don't fit your scale. The defended opinion is at the end and you may not like it: most teams should stop at question 5.
Every AWS-recommended workflow leads with a dashboard that shows you "here are 47 things you could optimize." That sounds right. It isn't. When somebody hands you a bill that surprised them, the signal you need first is not "what could you optimize." It is "what changed."
The bill jumped by $5,640. There is almost always one or two line items that explain most of the jump. Find those first. Everything else — Savings Plans coverage, gp2 to gp3, S3 lifecycle — is real money, but it is steady-state money. It was real last month too. It is not why the founder is messaging you on a Sunday.
So the order is: what changed, then what's idle, then what's oversized, then what's commitment-able. In that order. Not the other way around.
One-line summary: Billing Console → Cost Explorer → New report → Group by Service, last month vs the month before, sort by absolute change.
Time cost: 10 minutes.
Typically finds: 15–30% of the surprise.
If you have never opened Cost Explorer in this account, here is the click-by-click. You can do all of this with ce:GetCostAndUsage and ce:GetCostAndUsageWithResources IAM permissions — no admin access needed.
- Sign in to the AWS Console. In the top search bar, type
Billingand click Billing and Cost Management. - In the left sidebar of the Billing console, click Cost Explorer. If the account has never used it before, AWS shows a Launch Cost Explorer button. Click it and wait about a minute for the historical data to load.
- Once Cost Explorer is open, click Reports in the left sidebar, then click Create new report (or New report in the top-right corner — the wording shifts between UI versions).
- In the right-hand sidebar, find the Group by dropdown. Set it to Service.
- Find Date range in the same right sidebar. Choose Custom. Set the start to the first day of last month and the end to the last day of last month. If today is May 5, set
2026-04-01to2026-04-30. - Toggle on Compare to previous period (some accounts label this "Compare two date ranges"). Cost Explorer will infer the previous month as the comparison range.
- The table below the chart now has two dollar columns plus a delta column. Click the delta column header twice — once for descending sort, once more if the first click sorted ascending. The biggest absolute increases float to the top.
- Read the top two rows.
In nine audits out of ten, those top two rows tell you the story. The most common pattern I find is one of these three:
EC2 - Otherjumped by $1K–$5K. Almost always NAT Gateway data processing or cross-region transfer. (See Question 2 — that line item is a junk drawer and it deserves its own paragraph.)EC2 - Computejumped. Either someone provisioned a new fleet, an Auto Scaling Group is bouncing, or a Savings Plan rolled off and on-demand pricing kicked in.RDSjumped. Usually because a Multi-AZ flag got flipped, or storage autoscaling crossed a threshold, or a read replica got added in a different region.
Once you have the report set up, click Save as in the top right and name it something like MoM by Service — triage. Cost Explorer will keep it in the Saved reports list. If you do not have a saved month-over-month report in every account you operate, save one now. The next time a bill spikes, you will be ten clicks closer to the answer. (Cost Explorer documentation.)
For the Sunday-night $5,640 spike I opened this article with: $3,847.12 of it was NatGateway-Bytes in EC2 - Other. The team had migrated a batch job to a new VPC in the second week of the month. The job's destination was an S3 bucket. The new VPC did not have a Gateway VPC Endpoint for S3. Every byte of that job's output went through a NAT Gateway at $0.045/GB. 84.4 TB over three weeks.
That is one question. That is most of the answer.
One-line summary: Same Cost Explorer report as Question 1, but filtered to EC2 - Other and grouped by Usage Type.
Time cost: 5 minutes.
Typically finds: the specific line item that explains Question 1.
From the same Cost Explorer view you built in Question 1:
- Click Create new report again (or duplicate the previous one — most accounts have a Duplicate button on the saved report).
- In the right sidebar, find the Filters section. Click Add filter → Service.
- From the service list, scroll to and check the box next to EC2 - Other. Click Apply filter.
- Now in the same right sidebar, find Group by and change it from Service to Usage Type.
- Set Date range to Custom → last full calendar month.
- The table refreshes. You now see every usage-type code AWS billed inside the
EC2 - Otherbucket — usually 10 to 30 rows. - Click the dollar column header to sort descending.
- Scan the top rows for two patterns: any row whose name contains
NatGateway-Bytes(NAT Gateway data processing) and any row whose name containsDataTransfer-Regional-Bytes(cross-AZ traffic between availability zones in the same region).
EC2 - Other is the most-misunderstood line on an AWS bill. It is a junk drawer containing things that have nothing to do with EC2 compute. Inside it: NAT Gateway hourly and data charges, EBS volume hourly storage, EBS snapshot storage, inter-AZ data transfer, Elastic IP charges, ELB capacity unit consumption.
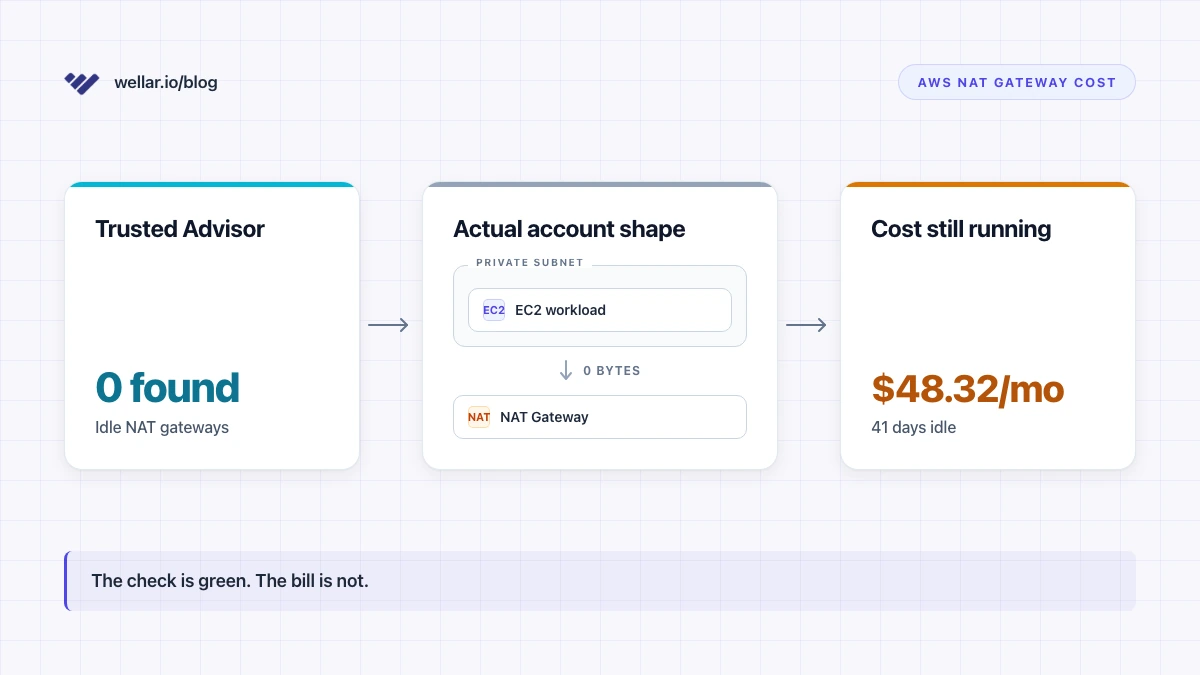
The single usage type that surprises people every time is the one with NatGateway-Bytes in the name. That is $0.045 per GB of data processed by a NAT Gateway, per region, on top of the $0.045/hour you pay for the gateway sitting there. (VPC pricing.) A batch job moving 10 TB through a NAT Gateway costs you 10,240 GB × $0.045 = $460.80 in data processing alone. Add the hourly: $0.045 × 730 = $32.85/mo for being on. If the destination is S3 or DynamoDB, this is entirely avoidable — a Gateway VPC Endpoint is $0/hour and $0/GB.
The other surprise inside EC2 - Other is DataTransfer-Regional-Bytes. That is cross-AZ traffic at $0.01/GB each way — yes, both directions, yes, between services in the same region. A chatty microservice pair that moves 50 TB/month across AZs costs you 50,000 × $0.02 = $1,000/mo for nothing except being in different subnets.
If you have not already, this is the place to read the longer breakdown — Trusted Advisor is wrong about your NAT Gateways goes through the metric thresholds AWS's own check misses.
Console path: EC2 Console → Volumes → Filter "State: available". VPC Console → Elastic IPs → Filter "Association: None". RDS Console → Snapshots → Filter "Age > 90 days, source DB deleted." Time cost: 15 minutes. Typically finds: $80–400/month at a 20-engineer SaaS, occasionally much more.
This is the pure-waste category. Resources that exist, get billed, and are doing nothing.
The CLI is faster than the console for this. One sweep across your largest region:
aws ec2 describe-volumes \
  --region us-east-1 \
  --filters Name=status,Values=available \
  --query 'Volumes[].{Id:VolumeId,GiB:Size,Type:VolumeType,Created:CreateTime}' \
  --output table
Detached gp3 volumes are $0.08/GiB/month. A 500 GiB orphan is $40/month for nothing. (EBS pricing.) The 60-engineer fintech I audited last quarter had 23 detached volumes totaling 4.1 TiB across two accounts — 4,100 × $0.08 = $328/month of pure waste. Eight of them had been detached for over a year.
Unattached Elastic IPs cost you $0.005/hour × 730 = $3.65/month each. (VPC pricing — the $0.005 figure is the current charge as of publish.) Small money individually. Easy to find in batches: every team I audit has 2–10 stranded EIPs.
RDS snapshots are the sneaky one. They are billed at $0.095/GB/month for engine-specific snapshots in us-east-1. A 500 GB snapshot of a deleted database is 500 × $0.095 = $47.50/month for memorabilia. I have found snapshots from 2022 in dev accounts during 2026 audits.
Skip this question if your bill is under $5K/month — the absolute dollars don't justify the time.
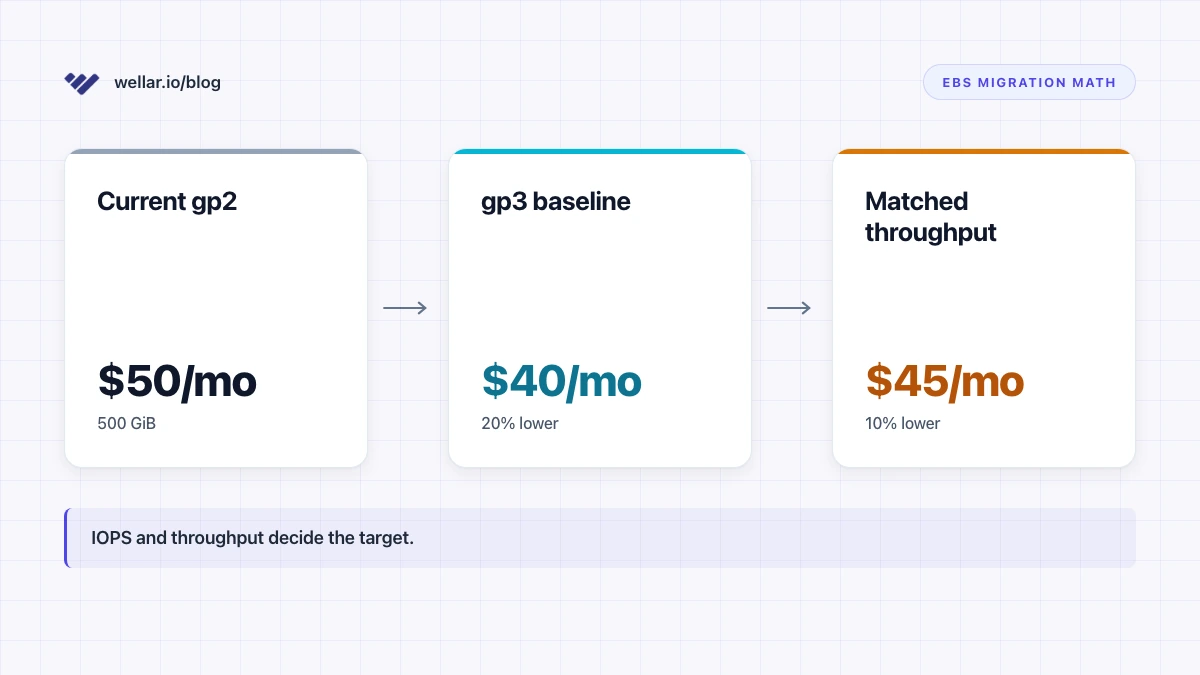
Console path: EC2 Console → Volumes → Filter Type: gp2 → Sort by Size descending. Time cost: 10 minutes for the count, longer for the migration. Typically finds: $100–500/month in pure storage, possibly more.
If you still have gp2 volumes in production in 2026, you are paying a 20% storage tax for nothing. The math is in aws gp2 to gp3 — the 20% savings claim has a footnote, and the short version is: gp3 is cheaper at the same performance for almost every workload below 16,000 IOPS.
The fast inventory:
aws ec2 describe-volumes \
  --region us-east-1 \
  --filters Name=volume-type,Values=gp2 \
  --query 'sum(Volumes[].Size)' \
  --output text
If that prints 4200, your ceiling is 4,200 GiB × $0.02/GiB/month = $84/month in pure storage, or roughly $1,000/year. That ceiling is before any per-IOPS or per-throughput add-backs — the linked article walks through the cases where preserving gp2-equivalent performance shrinks the win.
Don't blind-migrate. Read the metrics first. But this question's whole job is to surface the inventory.
One-line summary: CloudWatch → Metrics → CPUUtilization across your EC2 instances at p95 over 14 days. Time cost: 30 minutes for the top 10 instances. Typically finds: 1–3 oversized instances per 20-engineer team, each worth $50–300/month.
From the AWS Console:
- In the top search bar, type
CloudWatchand open the CloudWatch console. - In the left sidebar, click Metrics → All metrics.
- In the metrics browser, click the AWS namespaces tab (the default tab). Click EC2.
- Click Per-Instance Metrics. CloudWatch lists every running EC2 instance in this region, each appearing multiple times — once per metric. Use the search bar above the list to filter to
CPUUtilization. - Check the box next to each of your top 10 production instances (the ones you suspect are the largest). Each checked instance becomes a line on the chart at the top of the page.
- Above the chart, find the Statistic dropdown. Change it from
Averageto p95. CloudWatch will redraw the chart using the 95th-percentile value of CPU utilization rather than the mean. - Find the time-range selector in the top right. Change it from 3 hours to 2 weeks (14 days).
- Read the chart. Any instance whose p95 line stays below 10% for the full 14 days is a strong rightsizing candidate.
Right-sizing is the most-talked-about cost lever and one of the more tedious to actually run. The reason: you cannot rightsize off averages. An instance averaging 4% CPU but spiking to 80% at month-end is correctly sized. An instance whose p95 over fourteen days is 7% is not.
What I look at:
- CPUUtilization p95 over 14 days. Under 10% on a c-family or m-family instance is the strong signal.
- Memory. AWS does not publish memory utilization by default — you need the CloudWatch agent. If it isn't installed, treat memory as unknown and don't downsize aggressively.
- Network and EBS IOPS. Sometimes the CPU is low because the instance is I/O-bound. Check
NetworkIn/NetworkOutandVolumeReadOps/VolumeWriteOpsbefore deciding.
The rightsizing options most teams miss: going from m5.2xlarge to m5.xlarge is the obvious move and saves about $0.20/hour ($0.384 to $0.192 in us-east-1, roughly $140/month). Going from m5 to m7g (Graviton) is the less-obvious move and saves another 10–15% on top.
Same RDS rule applies. An RDS instance under 10% CPU at peak is a candidate for one size down. Multi-AZ in dev or staging is paying double for nothing.
I do not look at Compute Optimizer's recommendations until I have done this myself. Compute Optimizer is good at the easy ones and overly cautious on the medium ones — its recommendations leave money on the table because the default lookback is conservative. Read your own metrics first.
One-line summary: Cost Explorer → Savings Plans → Coverage report. Compare what you're covered for against your steady-state on-demand spend. Time cost: 30 minutes including a back-of-envelope baseline calc. Typically saves: 15–25% on covered compute. Skip if: under ~$3K/month of on-demand EC2 or Fargate.
How to actually read the Coverage report:
- From the AWS Console, open Billing and Cost Management again.
- In the left sidebar, scroll down to the Savings Plans section. Click Coverage report (sometimes labeled Utilization and coverage).
- Set Granularity to Monthly and the date range to the trailing 6 months.
- The chart at the top shows your coverage percentage over time — what fraction of your eligible compute spend was covered by an existing Savings Plan or RI. Read the trailing-6-month average.
- Below the chart, the table breaks coverage out by service (EC2, Fargate, Lambda). Look at each row's coverage percentage.
If the trailing-6-month coverage on EC2 + Fargate is under 60% and your on-demand compute spend is over $3K/month, you are probably leaving money on the table.
This is the first question on the list that costs money to act on. Everything above is "delete the waste." This is "make a commitment."
Open the Savings Plans Coverage report. If it shows you have under 60% coverage on your steady-state baseline compute, you are probably leaving money on the table. A 1-year No Upfront Compute Savings Plan saves about 27% versus on-demand for an m5.xlarge in us-east-1 (Savings Plans pricing).
The trap is buying more coverage than your true baseline. Savings Plans are use-it-or-lose-it commitments. If you overbuy, you pay for capacity you don't use and the math flips against you. The way I size it: take the trailing 12 months of on-demand compute spend, find the 25th percentile of the monthly values, and commit to that. You will leave a little money on the table at peak — that is fine. The downside of overbuying is much worse than the downside of slightly underbuying.
I have changed my mind on Reserved Instances. They were the right answer in 2018. Compute Savings Plans, which AWS launched in November 2019, replaced their job for almost every team I work with. For new commitments now, I do not buy RIs anymore — the flexibility you give up with an RI is not worth the marginal extra savings versus a Compute Savings Plan, and the math on instance-family changes is a tax I do not want to pay every time we want to migrate from m5 to m7g.
If you are under $3K/month of compute, skip this question entirely. The discount is real but the failure mode of overcommitting at small scale is worse than the savings.
One-line summary: Use S3 Storage Lens to see how much of your S3 sits in STANDARD vs cheaper storage classes. If most of the cold data is in STANDARD, lifecycle policies will pay back.
Time cost: 1 hour, including a lifecycle policy draft.
Typically finds: material savings if you have over 1 TB of S3 in STANDARD.
Skip if: under ~1 TB of S3.
To get the inventory:
- In the AWS Console, open the S3 service.
- In the left sidebar, click Storage Lens → Dashboards. AWS provides a free default dashboard for the account.
- Open the default dashboard. Find the Storage class distribution card.
- Read the breakdown: how many TB are in
STANDARD,STANDARD_IA,INTELLIGENT_TIERING,GLACIER_IR,GLACIER_FLEXIBLE,GLACIER_DEEP_ARCHIVE. If 90%+ of your bytes are inSTANDARD, you almost certainly have an opportunity. - To check a specific bucket: go to Buckets, click the bucket name, then click the Metrics tab. The storage-class chart is at the bottom.
The default S3 storage class is STANDARD at $0.023/GB/month in us-east-1. Cold data that hasn't been read in 90 days sitting in STANDARD is roughly 5x what it should cost — Glacier Instant Retrieval is $0.004/GB/month for the same single-digit-millisecond access. (S3 lifecycle considerations.)
For a 10 TB bucket of logs that get written once and never read after the first week: 10,000 × ($0.023 - $0.004) = $190/month you are paying for nothing. The lifecycle policy that fixes it is about twenty lines of JSON.
Why this is question 7 and not question 3: lifecycle policies take engineering time to design carefully. There are transition charges, minimum storage durations (30 days for Standard-IA, 90 days for Glacier IR), and minimum object sizes (objects under 128 KB don't transition cleanly). For a bucket of small objects, lifecycle policies can cost you money on the transition fees if you do them naively. This is not "click and done." It is a small engineering project.
For a team under 1 TB of S3, the absolute savings don't justify the work. Move on.
Console path: CloudWatch Logs → Log Groups → Sort by Stored Bytes descending. Cost Explorer → Group by Usage Type → Filter Service: CloudWatch. VPC Flow Logs aggregator for cross-AZ traffic.
Time cost: 1 day, minimum. Probably a week.
Typically finds: real savings, but only at scale.
Skip if: under ~50 engineers or under ~$30K/month AWS spend.
This is where FinOps stops being triage and starts being engineering. The categories:
- CloudWatch log retention. The default is "Never expire." If you have 200 log groups all set to never expire, you are paying $0.03/GB/month in perpetuity for logs nobody has read since the day they were written. (CloudWatch concepts.) Setting retention to 30 or 90 days on the boring log groups is a one-line API call per group, but identifying which ones are safe to expire takes care.
- Custom CloudWatch metrics. Custom metrics cost $0.30/metric/month after the first 10K. A team that's auto-emitting a metric per route per service can easily have 100K custom metrics. That's $30K/month for telemetry. The fix is either consolidating dimensions or moving to a metric-aggregation pattern, both of which are engineering projects.
- Cross-AZ data transfer. If two services that talk a lot are in different AZs, you are paying $0.02/GB round-trip on every message. Co-locating them is an architecture change.
- Multi-region replication. Useful for compliance and disaster recovery. Expensive if you turned it on for everything because the docs implied it was best practice.
Each of these is a multi-day project. They pay back in months, not days. They are the right work if you are at scale. They are the wrong work if you are at twelve engineers and the engineering time is the binding constraint on the company.
Three rules in order:
- Stop when the next question costs more engineer-hours than the savings will return in three months. If you are debating between spending a day on Question 8 and shipping a feature that closes a deal, ship the feature.
- Stop when you have found one root cause that explains 60% of the surprise. Don't keep going just to feel thorough. The whole point of running the questions in order is that one question usually answers it.
- Stop when the founder says "okay, we have a plan." The audit is not the work. The audit is the input to the work.
The opinion you may not like: most teams should stop at question 5. A 25-engineer SaaS will recover 70–85% of their realistic savings in the first five questions. The remaining 15–30% lives in Savings Plans modeling, S3 lifecycle policies, and CloudWatch architecture — each of which is a multi-day project, and unless you have someone whose half-time job is cost, the engineering time costs more than the savings return.
The opportunity cost of cost optimization is shipping. Senior engineers know this. The thirty-item checklists that the rest of the internet hands you don't tell you that, because their job is to look thorough.
I run this triage for free on Wellar — wellar.io connects in five minutes via a read-only IAM role, runs the equivalent of questions 1 through 7 across your accounts, and produces the same triage sheet I would have written by hand. It does not replace the engineering judgment in this article. It replaces the eight hours of clicking that would have produced the inputs.
Either way, the thirty-item checklist isn't an audit. It's a chore list. The audit is the order.